Lab 8
Spectral Signature Analysis and Resource Monitoring
Goals and Background:
One of the primary objectives for lab eight was to gain experience on the measurement and interpretation of spectral reflectance signatures of different surface materials. Another important objective of the lab was to perform resource monitoring of certain Earth resources. This was done by using remote sensing band/ratio techniques.
Other objectives for lab eight included the gathering of spectral signatures from remotely sensed images, graphing these signatures, and then analyze these signatures. This led into the analysis of the health of vegetation and soil of the surrounding region.
Methods:
Part one of the lab included spectral analysis. This was performed on twelve different materials and surfaces from an image of Eau Claire and the surrounding region. The spectral signatures analyzed from the Eau Claire area included the signatures of standing water, moving water, forest, riparian vegetation, crops, urban grass, dry soil, moist soil, rock, asphalt highway, airport runway, and a concrete surface.
The spectral analysis process began with the use of the polygon tool to digitize an area within the desired material or surface. Next, the supervised signature editor raster tool was used to analyze the signatures. The signature mean plot (SMP) was then displayed from the signatures. The plots for each of the signatures were displayed separate and all together. This same process was repeated for all twelve signatures.
Part two of the lab involved two sections. Section one of the two sections involved the vegetation health monitoring of the Eau Claire area. This was done by using the normalized difference vegetation index (NDVI). The raster-unsupervised-NDVI tool was used perform the task. After the tool was ran, an equal interval map was generated in Arc Map showing the five different classes of vegetation abundance.
Part two of the two sections included the soil health monitoring of the Eau Claire area. This was done by analyzing the ferrous mineral ratio of the soil in the area to look at the distribution of iron contents in the soil. The raster-unsupervised-indices tool was used to accomplish this task. After the model was run an equal interval map with five classes was generated in Arc Map showing the spatial distribution of ferrous minerals in the Eau Claire area.
Results:
Results from part one of the lab are shown below.
Figure 1. Figure one (above) shows the signature mean plot (SMP) of the spectral signature of standing water. Reflectance is high in band 1 (blue band).
Figure 2. Figure two (above) shows the SMP of the spectral signature of flowing water. Flowing water had a higher reflectance in band 4 (NIR) than standing water.
Figure 3. Figure three (above) shows the SMP of the spectral signature of a forest. Forest reflects high in band 4 (NIR).
Figure 4. Figure four (above) shows the SMP of the spectral signature of riparian vegetation. Riparian vegetation had high reflectance in band 4 (NIR).
Figure 5. Figure five (above) displays the SMP of the spectral signature of crops. Crops had high reflectance in band 5 (MIR) indicating that the field they were planted in had high amounts of moisture. The crops were likely young which allowed this to show so predominantly.
Figure 6. Figure six (above) shows the SMP of the spectral signature of urban grass. Urban grass had high reflectance in band 4 (NIR).
Figure 7. Figure seven (above) represents the SMP of the spectral signatures of dry soil. Dry soil reflected high in band 3 (red).
Figure 8. Figure eight (above) represents the SMP of wet soil. Wet soil had a high reflectance in band 5 (MIR) indicating a high moisture content.
Figure 9. Figure nine (above) shows the SMP of rock. Rock had low reflectance in band 4 (NIR).
Figure 10. Figure ten (above) shows the SMP of an asphalt highway. This asphalt highway is reflecting high in band 4 indicating there was some vegetation captured in the polygon. This means the highway had high amounts of vegetation growing around it.
Figure 11. Figure eleven represents the SMP of an airport runway. This runway is reflecting high in band 3 (red).
Figure 12. Figure twelve (above) shows the SMP of a concrete surface. This surface had high reflectance in band 3 (red).
Figure 13. Figure thirteen (above) displays a comparison between wet and dry soil. Wet soil had higher reflectance in band 5 (MIR) indicating more moisture.
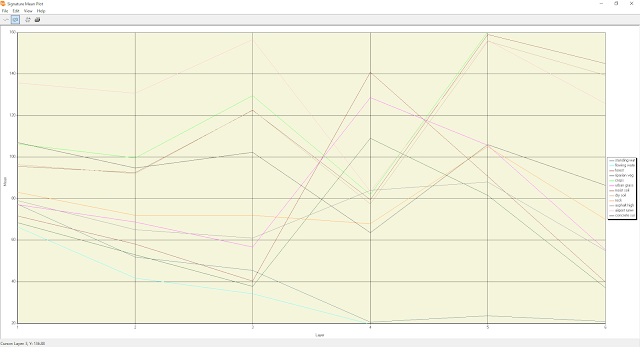
Figure 14. Figure fourteen (above) shows all of the SMPs on the same plot.
Below are the results from part two.
Figure 15. Figure fifteen (above) represents an equal interval map of the vegetation in the Eau Claire region. Dark green represents areas with high amounts of vegetation.
Figure 16. Figure sixteen (above) represents an equal interval map of the ferrous mineral content of the soil in the Eau Claire region. Areas that are darker in red have a higher ferrous mineral content. Areas that are dark green are mostly vegetation.
Sources:
Satellite image is from Earth Resources Observation and Science Center, United States Geological Survey.
United States Geological Survey. (2013). Home Page | Earth Resources Observation and Science (EROS) Center. Retrieved from http://eros.usgs.gov/


