Lab 7
Photogrammetry
Goals and Background:
Lab seven involved the development of photogrammetric skills. Specifically, we performed photogrammetric tasks on aerial photographs and satellite image. The overall goal of this lab was to gain the experience necessary to perform various photogrammetric tasks.
There were three main parts to the lab. Part one will not be included in this lab report. However, part one of the lab involved calculating scale of nearly vertical aerial photographs. Part one also involved the measurement of areas of features on aerial photographs. Part two of the lab (stereoscopy) involved the generation of a three dimensional image using an elevation model. Lastly, part three of the lab included the use of Erdas Imagine Lecia Photogrammetric Suite (LPS) for the use of triangulation and orthorectification of images.
Methods:
The stereoscopy (part two) portion of the lab was divided into two sections. Section one involved the creation of an anaglyph image with the use of a digital elevation model (DEM). This was done by using an image of the city of Eau Claire and a DEM of Eau Claire. The terrain-anaglyph tool was used to generate the anaglyph image. Section two of part two involved the creation of an anaglyph image with the use of a LiDAR derived surface model (DSM). This was done by using an image of Eau Claire and a DSM of Eau Claire. The same terrain-anaglyph tool was used.
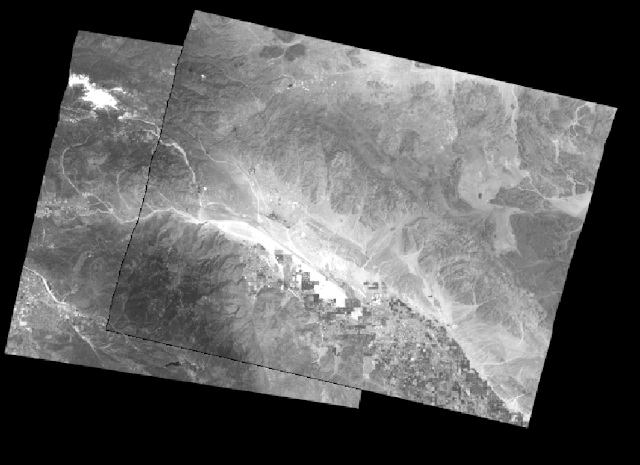
The orthorectification (part three) portion of the lab was divided into six sections. Section one simply involved the creation of a new project using SPOT satellite images of Palm Springs, California. The toolbox-image photogrammetry tool was used to create a new project. The geometric model category for this project SPOT Pushbroom. The horizontal reference coordinate system parameters were as followed. The projection type was UTM, the spheroid name was Clarke 1866, the datum name was NAD27 (CONUS), and the UTM zone was 11.
Section two of part three involved adding imagery to the block and define sensor model. First the panchromatic image was added to frame. The default parameters were accepted for the SPOT Pushbroom frame editor. Section three included the collection of ground control points (GCPs). The classic point measurement tool was used, and GCPs were collected with the help of a reference image which was displayed along side the panchromatic image. A total of 11 GCPs were collected. The last two GCPs were collected from a different horizontal reference source, and the Palm Springs DEM was selected as the vertical reference source.
Section four of part three involved the collection of GCPs on the second image. First, a second panchromatic image was brought into the task manager, and default parameters were accepted. GCPs were collected on the new image that corresponded with the previous panchromatic image. This led into section five where tie points were collected automatically. The automatic tie point generation properties tool was used. The image used radio button was set to all available and the initial type radio button was set to exterior/header/GCP. Intended number of points/image was set to 40. After tie points were collected, triangulation was performed. The triangulation parameters were set in the following manner. Maximum normal interations was set to 5, interations with relaxation was set to 3, and the image coordinate units for report were set to pixels. The same weighted values were set to 15 for the x, y, and z options. Default settings were accepted for the rest and a triangulation summary report was generated. Finally, orthorectified images were generated. This was done by selecting the start ortho resampling process icon. DTM source was set to DEM, DEM file name was set to the Palms Springs DEM image, and the output cell sizes were set to 10. In the advanced settings the resampling method was set to bilinear interpolation. The second panchromatic image was then added and the model was run.
Section six involved viewing the orthorectified image.
Results:
Below is the result from part two section one.
Figure 1. Figure one above shows the anaglyph from part two section one.
Below is the result from part two section two.
Figure 2. Figure two above shows the anaglyph from part two section two.
Below is my result from part three showing the orthorectified images.
Figure 3. Figure three above shows the orthorectified image from part three of the lab. The overlap of the area is spatially accurate.
Sources:
Home | NRCS. (2010). Retrieved from https://www.nrcs.usda.gov/wps/portal/nrcs/site/national/home/
NAIP Imagery. (2005). Retrieved from https://www.fsa.usda.gov/programs-and-services/aerial-photography/imagery-programs/naip-imagery/index
National Aerial Photography Program (NAPP) | The Long Term Archive. (2009). Retrieved from https://lta.cr.usgs.gov/NAPP


No comments:
Post a Comment